


LMS improvement

If you’re in an HR or Learning and Development team, you’re responsible for the organisation’s most precious asset: its people.
You have the incredible opportunity everyday to inspire, to mould and to transform employees into invaluable team members who deliver work that they, their peers and their superiors can all be proud of.
With something so important at stake, we need to make sure we remove as much guesswork as possible in order to achieve the results we want as quickly as possible and keep our stakeholders happy.
And that’s where data analytics come in.
I’m writing this post because we’ve been asked on many occasions by L&D professionals of late how they can access and use data to evaluate and measure LMS improvement.
The fact that this is a challenge for so many people speaks to a core issue we have with off-the-shelf LMS and why we are dedicated to helping companies build their own, powerful bespoke platforms.
So, why is data analytics important in helping you improve LMS performance?
Imagine your LMS is a car. You have a destination in mind and you have lots of very important people that you want to take there.
However, the only information this car gives you is the number of miles you’ve travelled. There’s no speedometer, no GPS, no fuel gauge, no tyre pressure, no engine temperature, no battery level indicator.
You can steer and drive, and yes, you can just about get to your destination.
But you have no idea of the quickest route to take to get there, if the engine is overheating or how much fuel you have left in the tank.
Data analytics is the dashboard providing real-time information to help you take your people on the desired journey as quickly and effectively as possible.
The LMS market is dominated by off-the-shelf LMS platforms such as Cornerstone and Nimble which do have many benefits.
However, one of the key issues with these platforms is that, we believe, they don’t offer enough data to give us the powerful insights we need to make effective decisions for our people and for our organisation.
Very often, all we can see is content or course completions per user.
What we can’t see is how people actually use the system, which content is particularly engaging and insightful, and whether particular aspects of the system are performing well or not with certain user groups.
After all, everyone who uses the system has different levels of experience, expertise and ambition.
And we need to be able to see exactly how users are engaging with the system to understand how to quantify improvement and ensure it’s performing optimally.
Because of these data gaps in many of the most popular LMS products, we’ve worked with some of the biggest companies in the world to help them create a bespoke analytics platform that integrates perfectly with their system.
That means we can go from having very little understanding of how well our LMS is performing to having a complete picture.
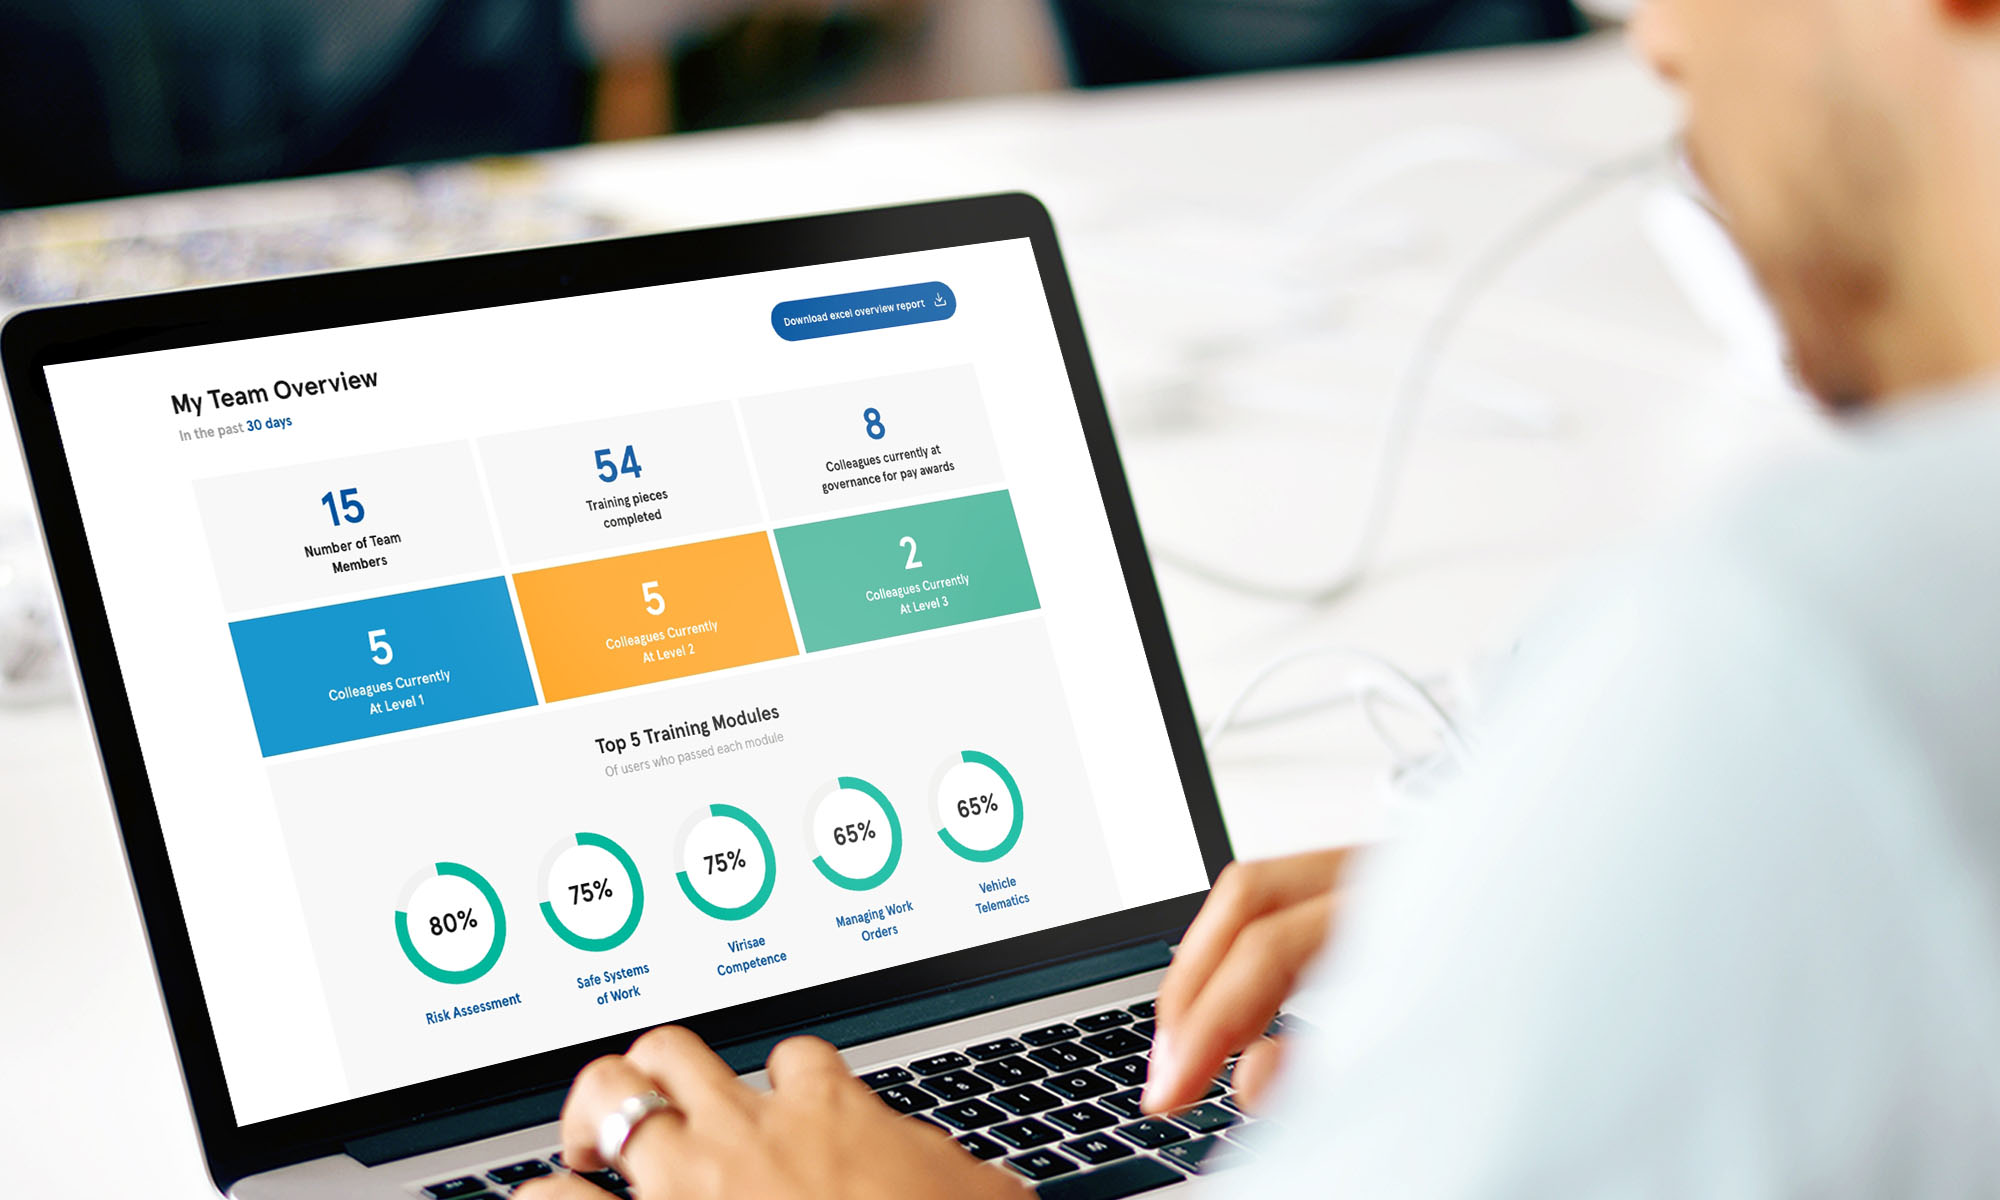
Now, how much more do you think you could achieve and how much more powerful would your LMS be if you had access to the data below at your fingertips?

By having access to this data in one place, it means you can make improvements based on your insights and then actually measure the impact of the changes you made quickly and easily.
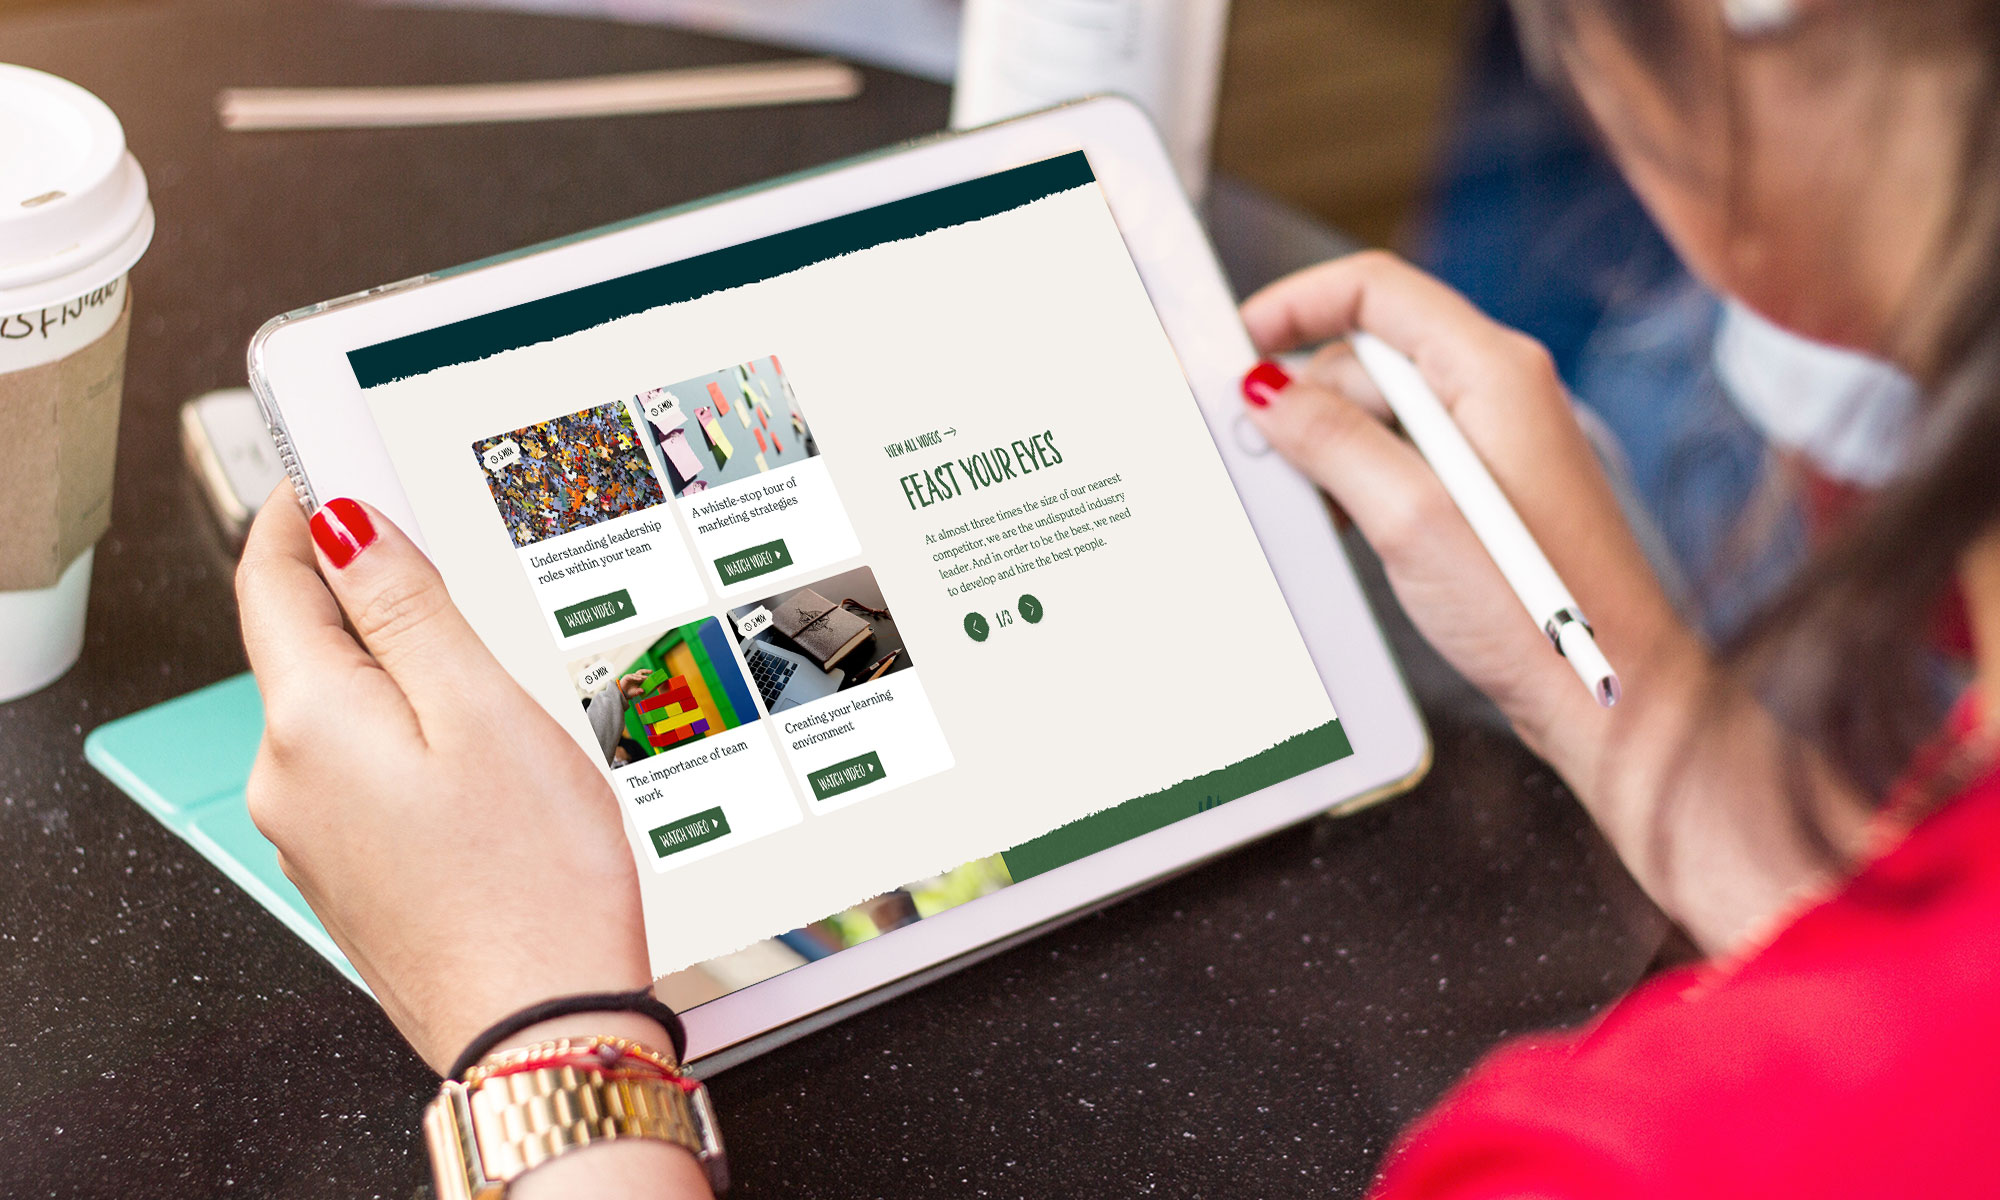
It then also gives you the opportunity to test different variations of your content so you can optimise it effectively and ensure it’s as engaging and useful as possible.
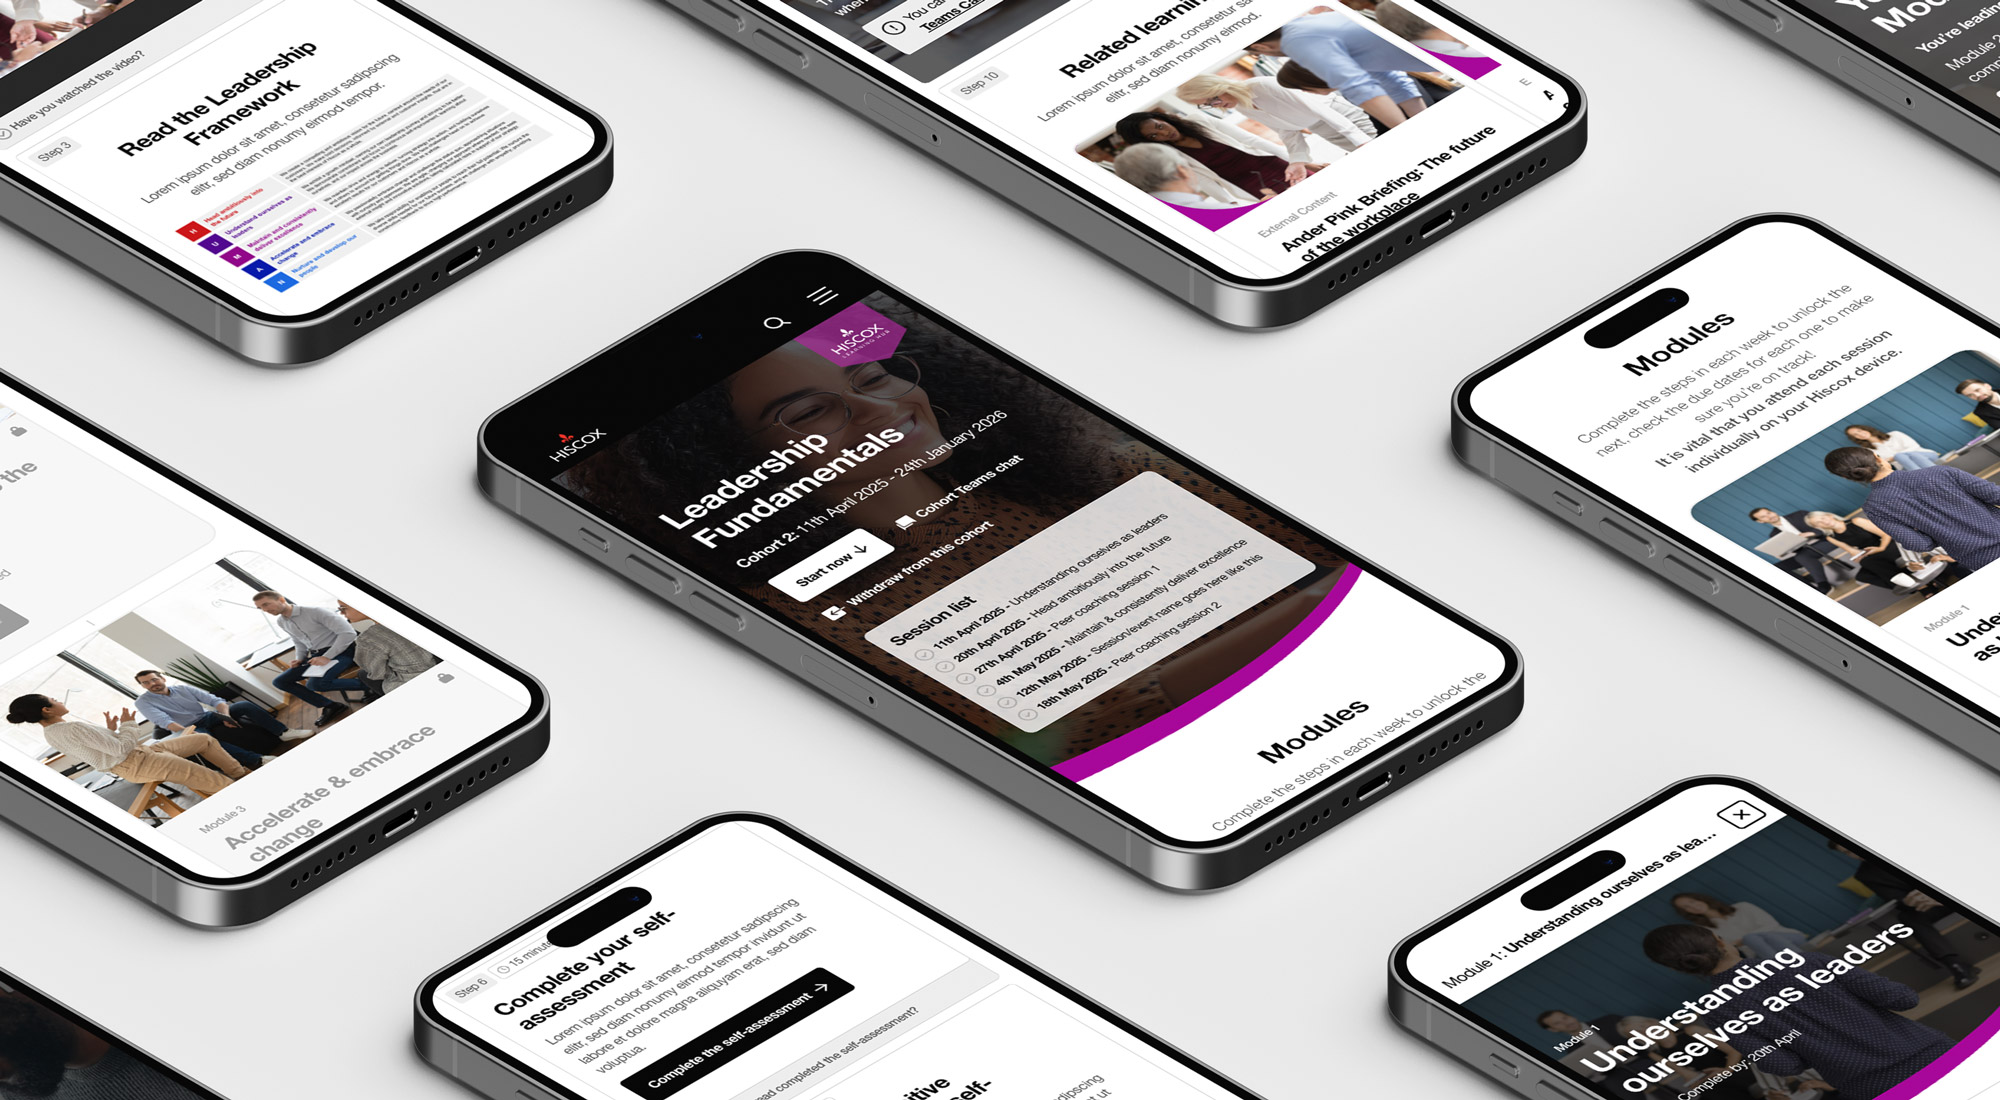
Hiscox
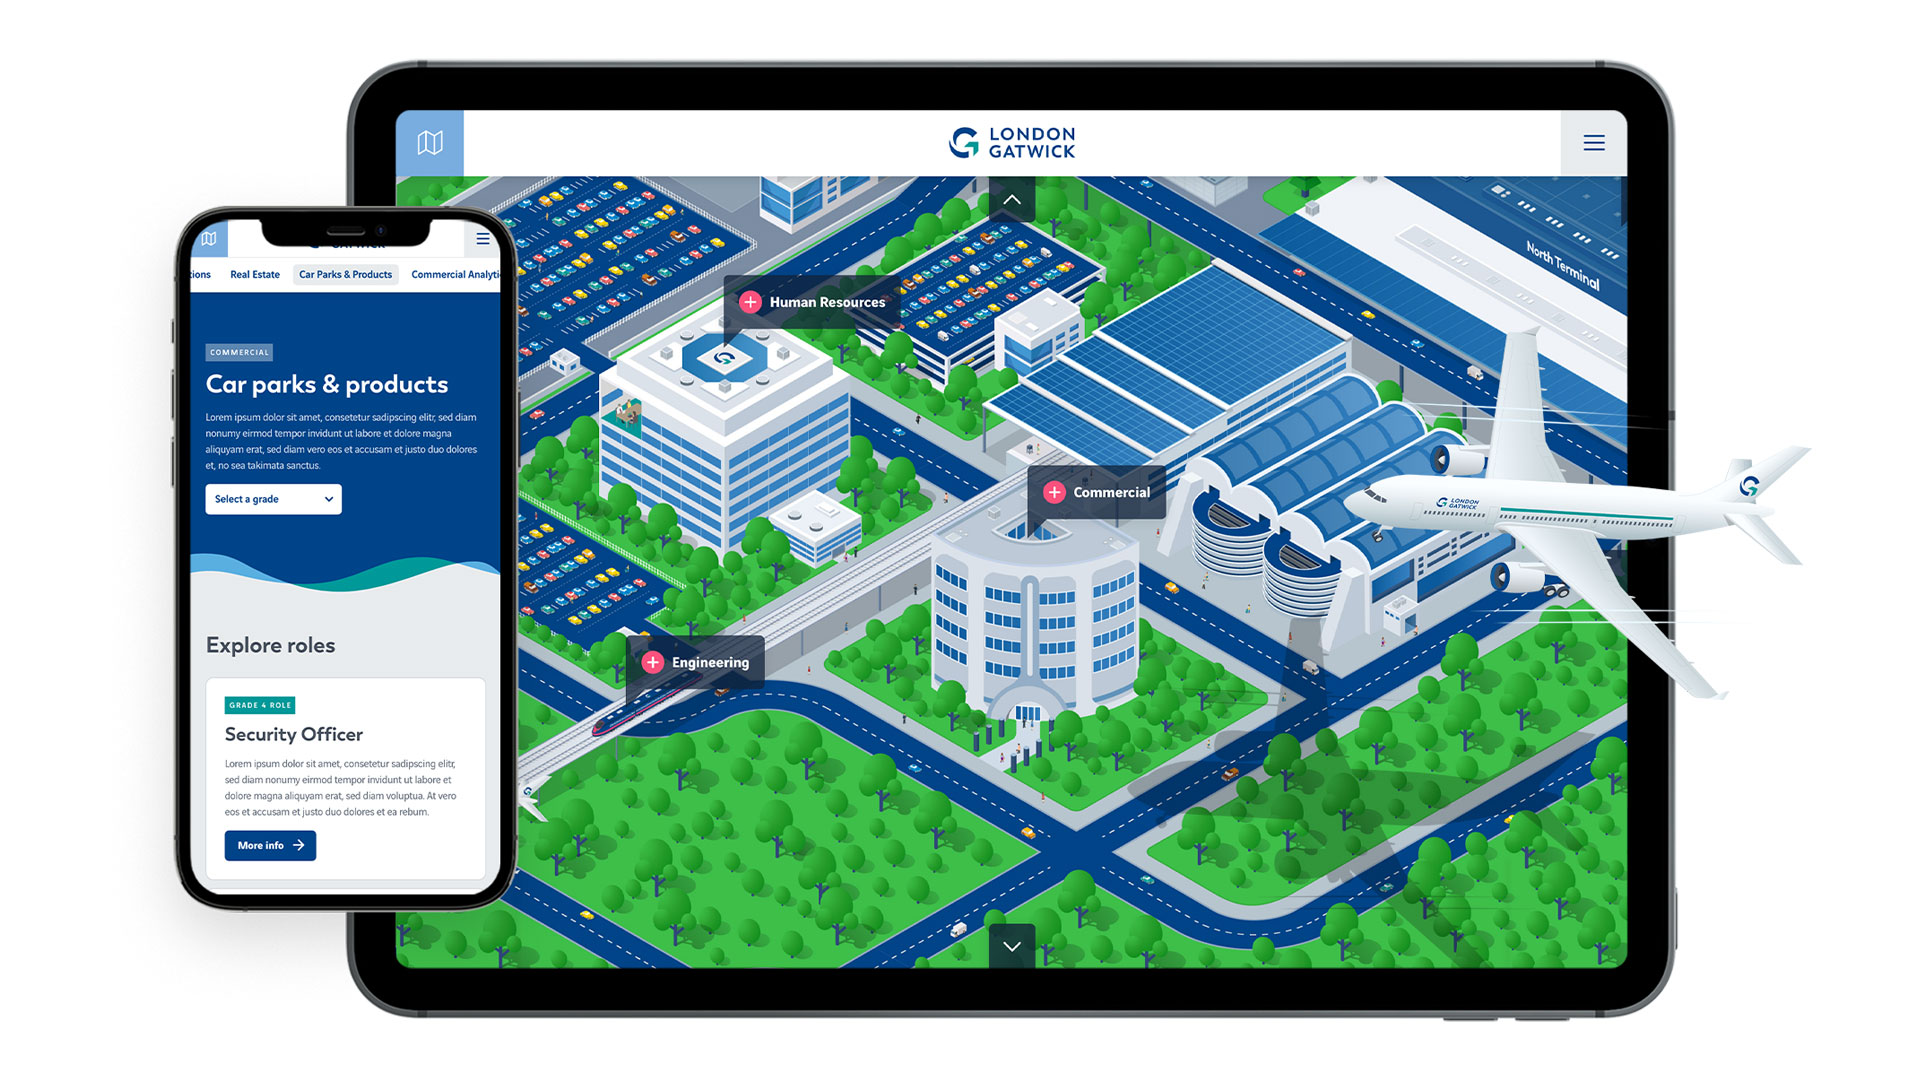
Gatwick

PGL
Tesco

Tesco

Tesco
Nomad Foods

Tesco

First Bus

Cognita

Cygnet
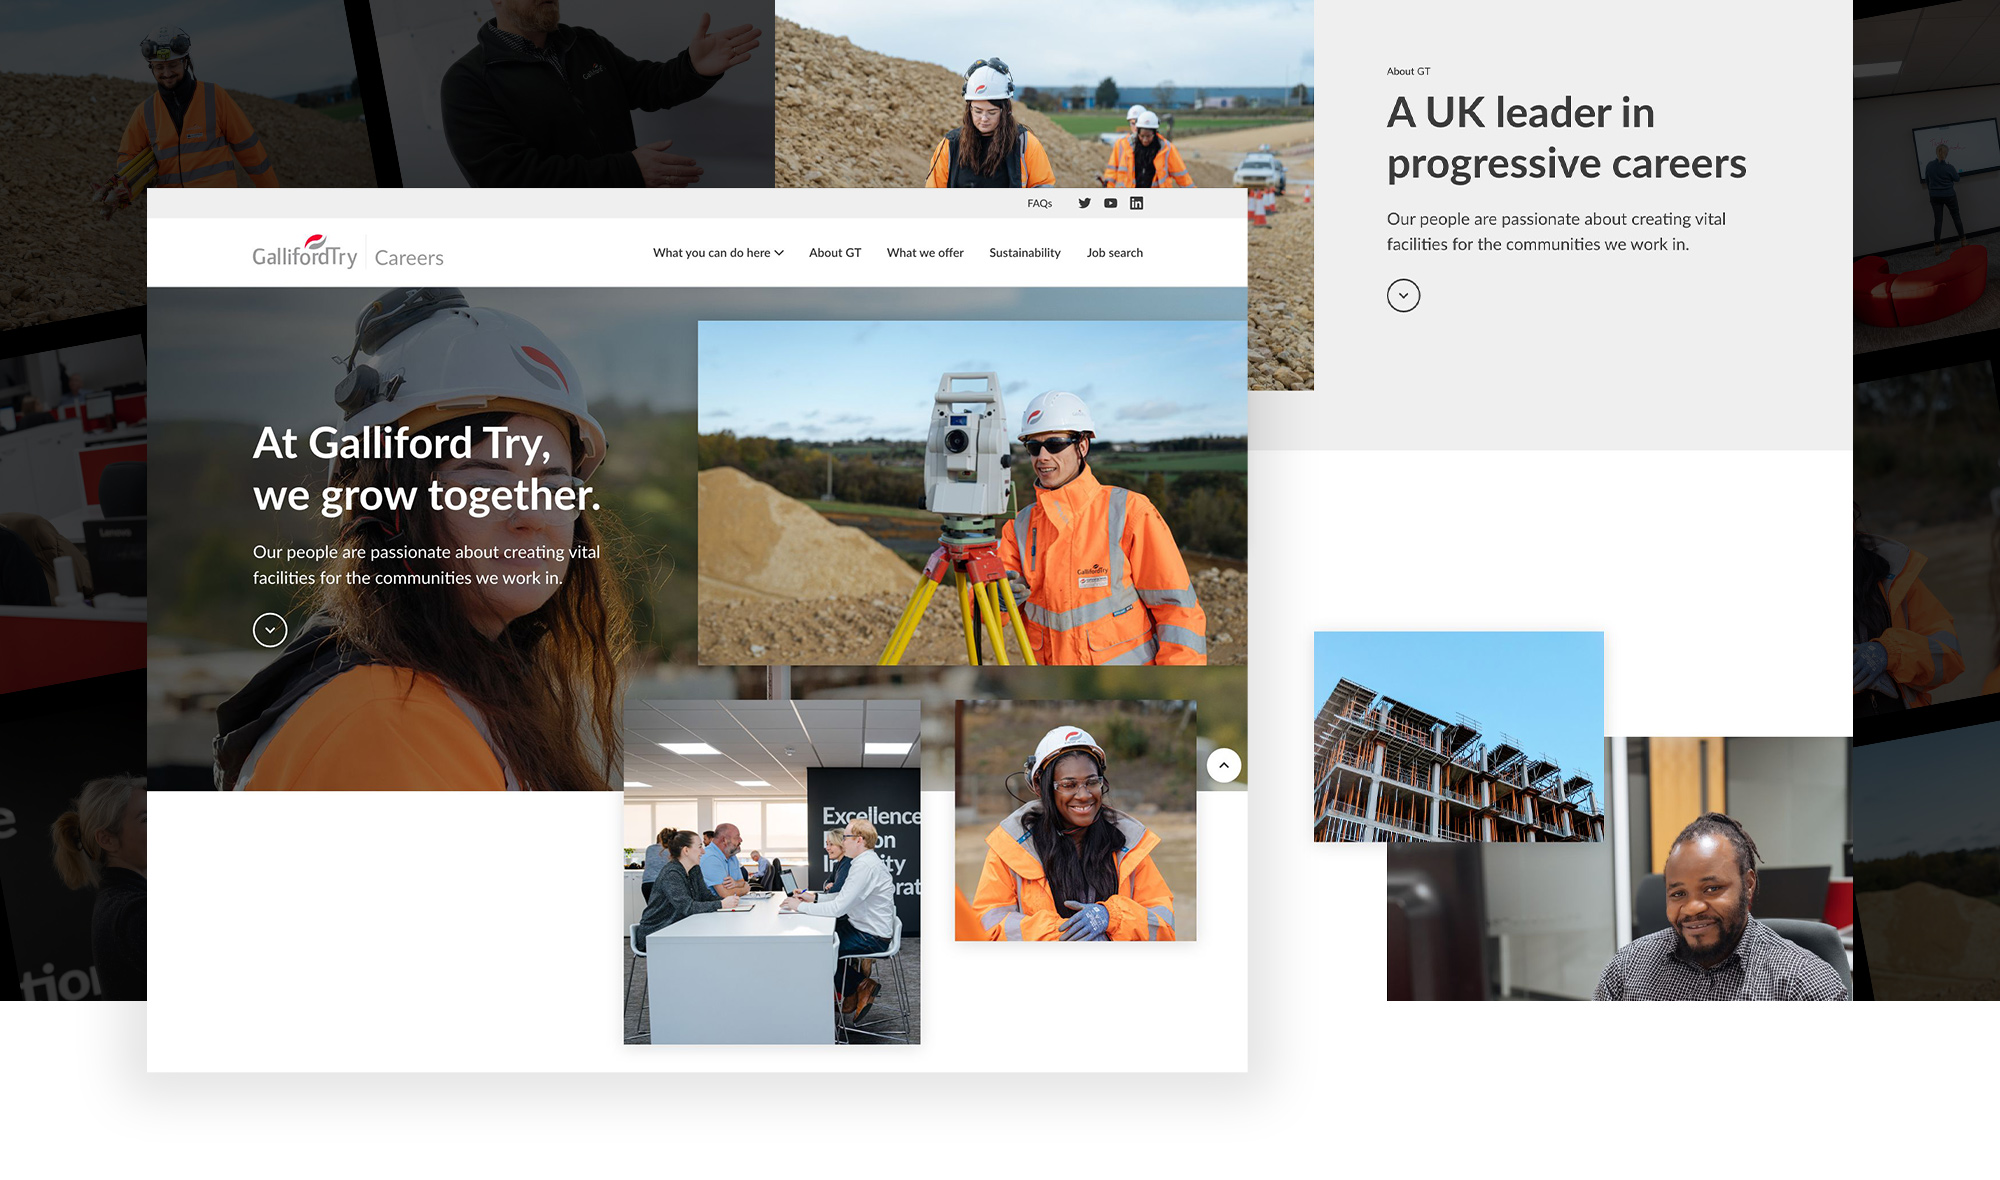
Galliford Try

LW theatres

Cygnet
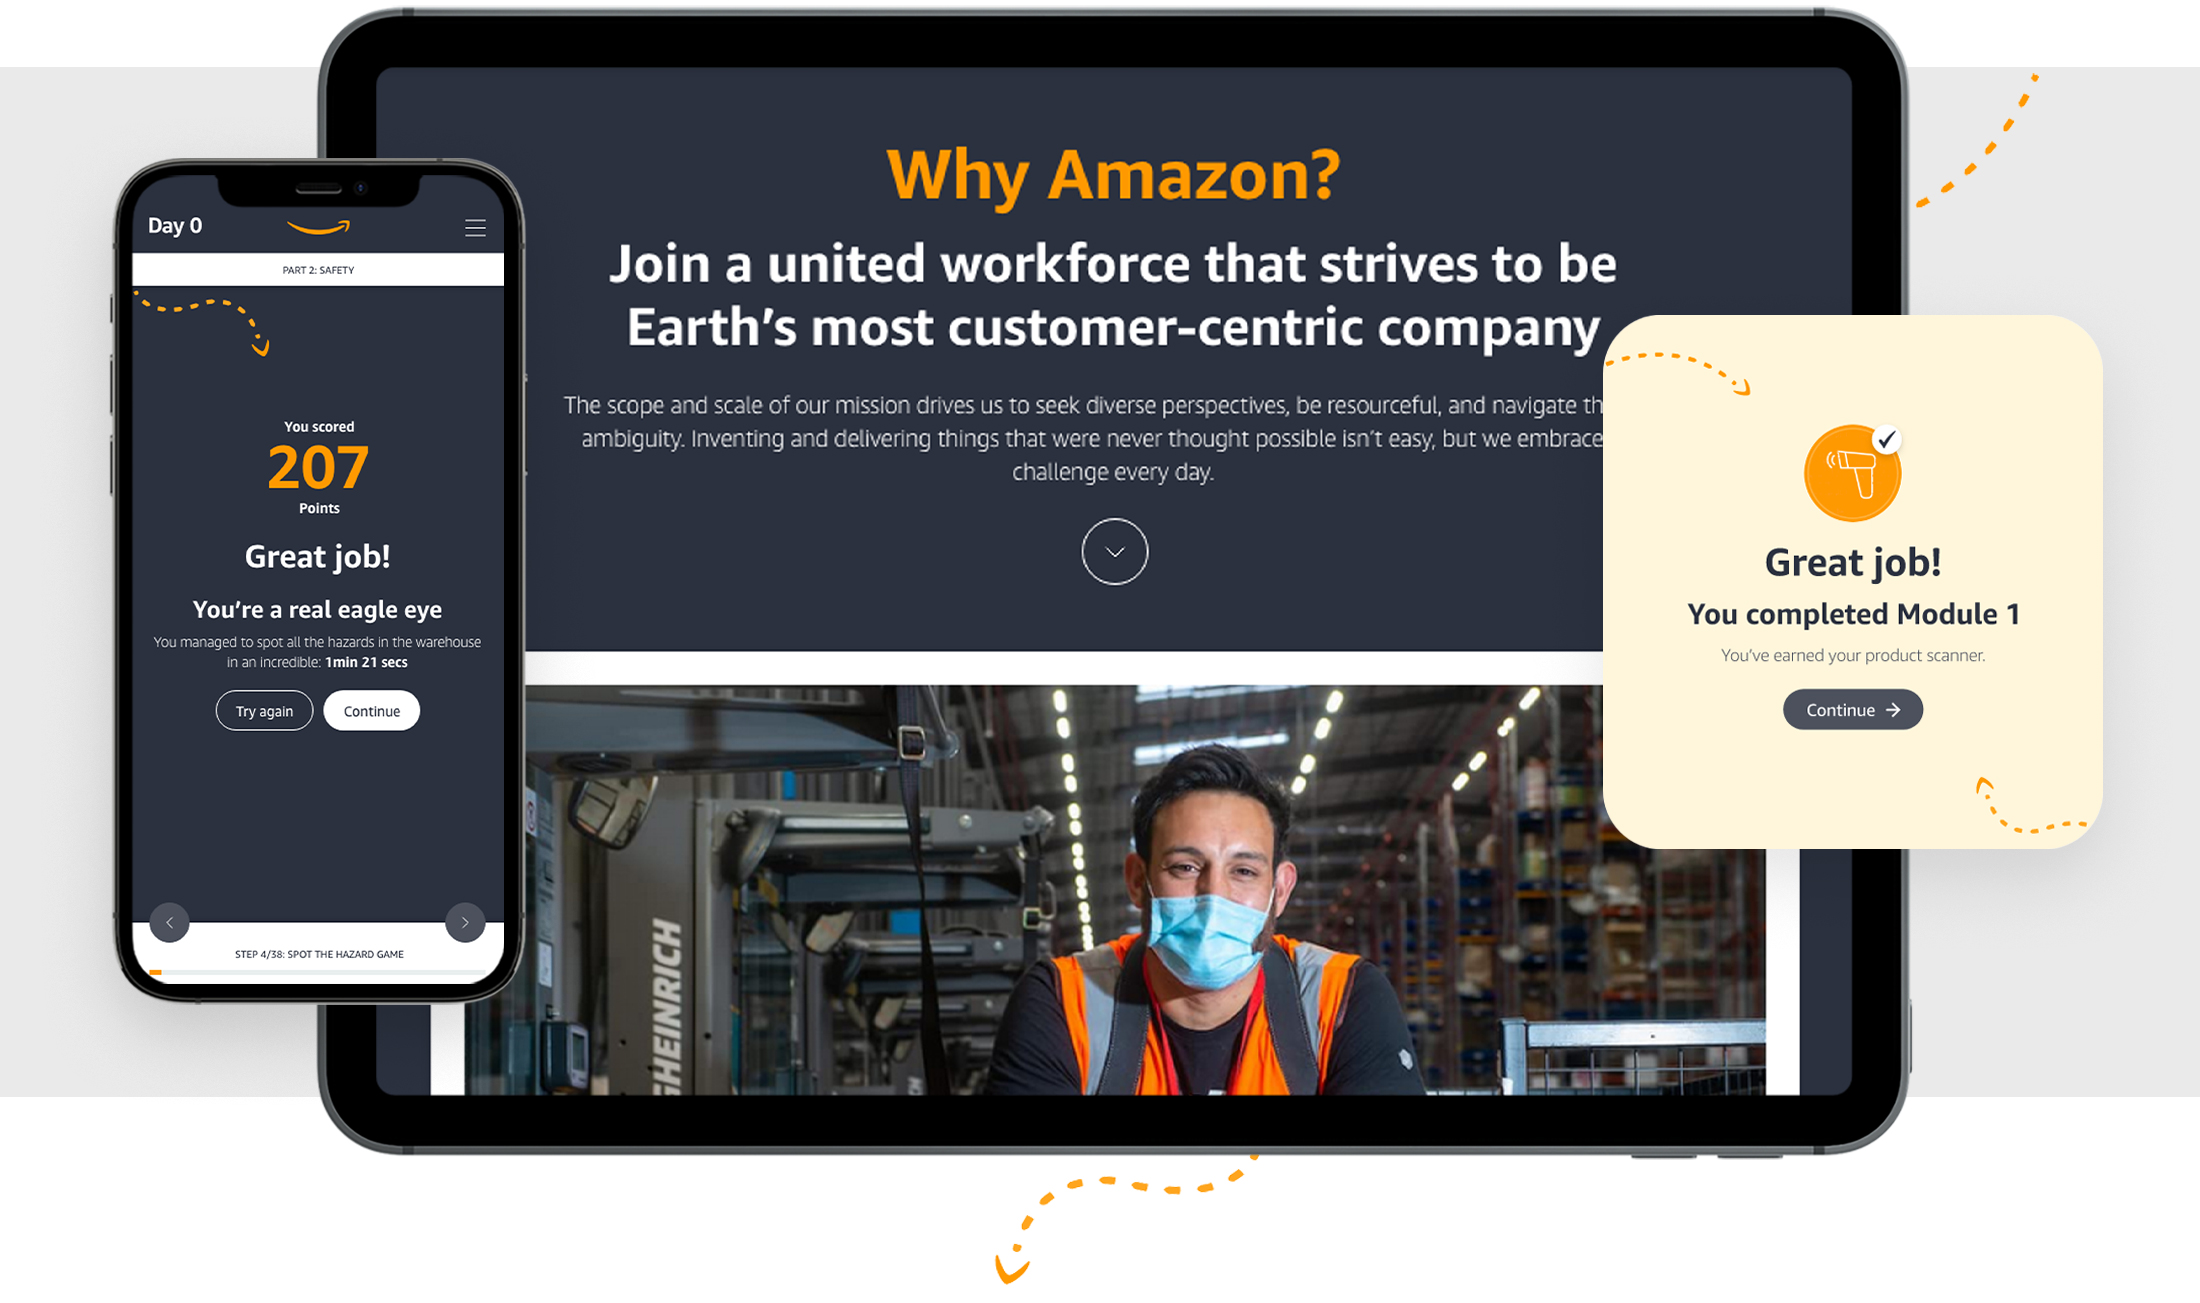
Amazon

ACG

MARS
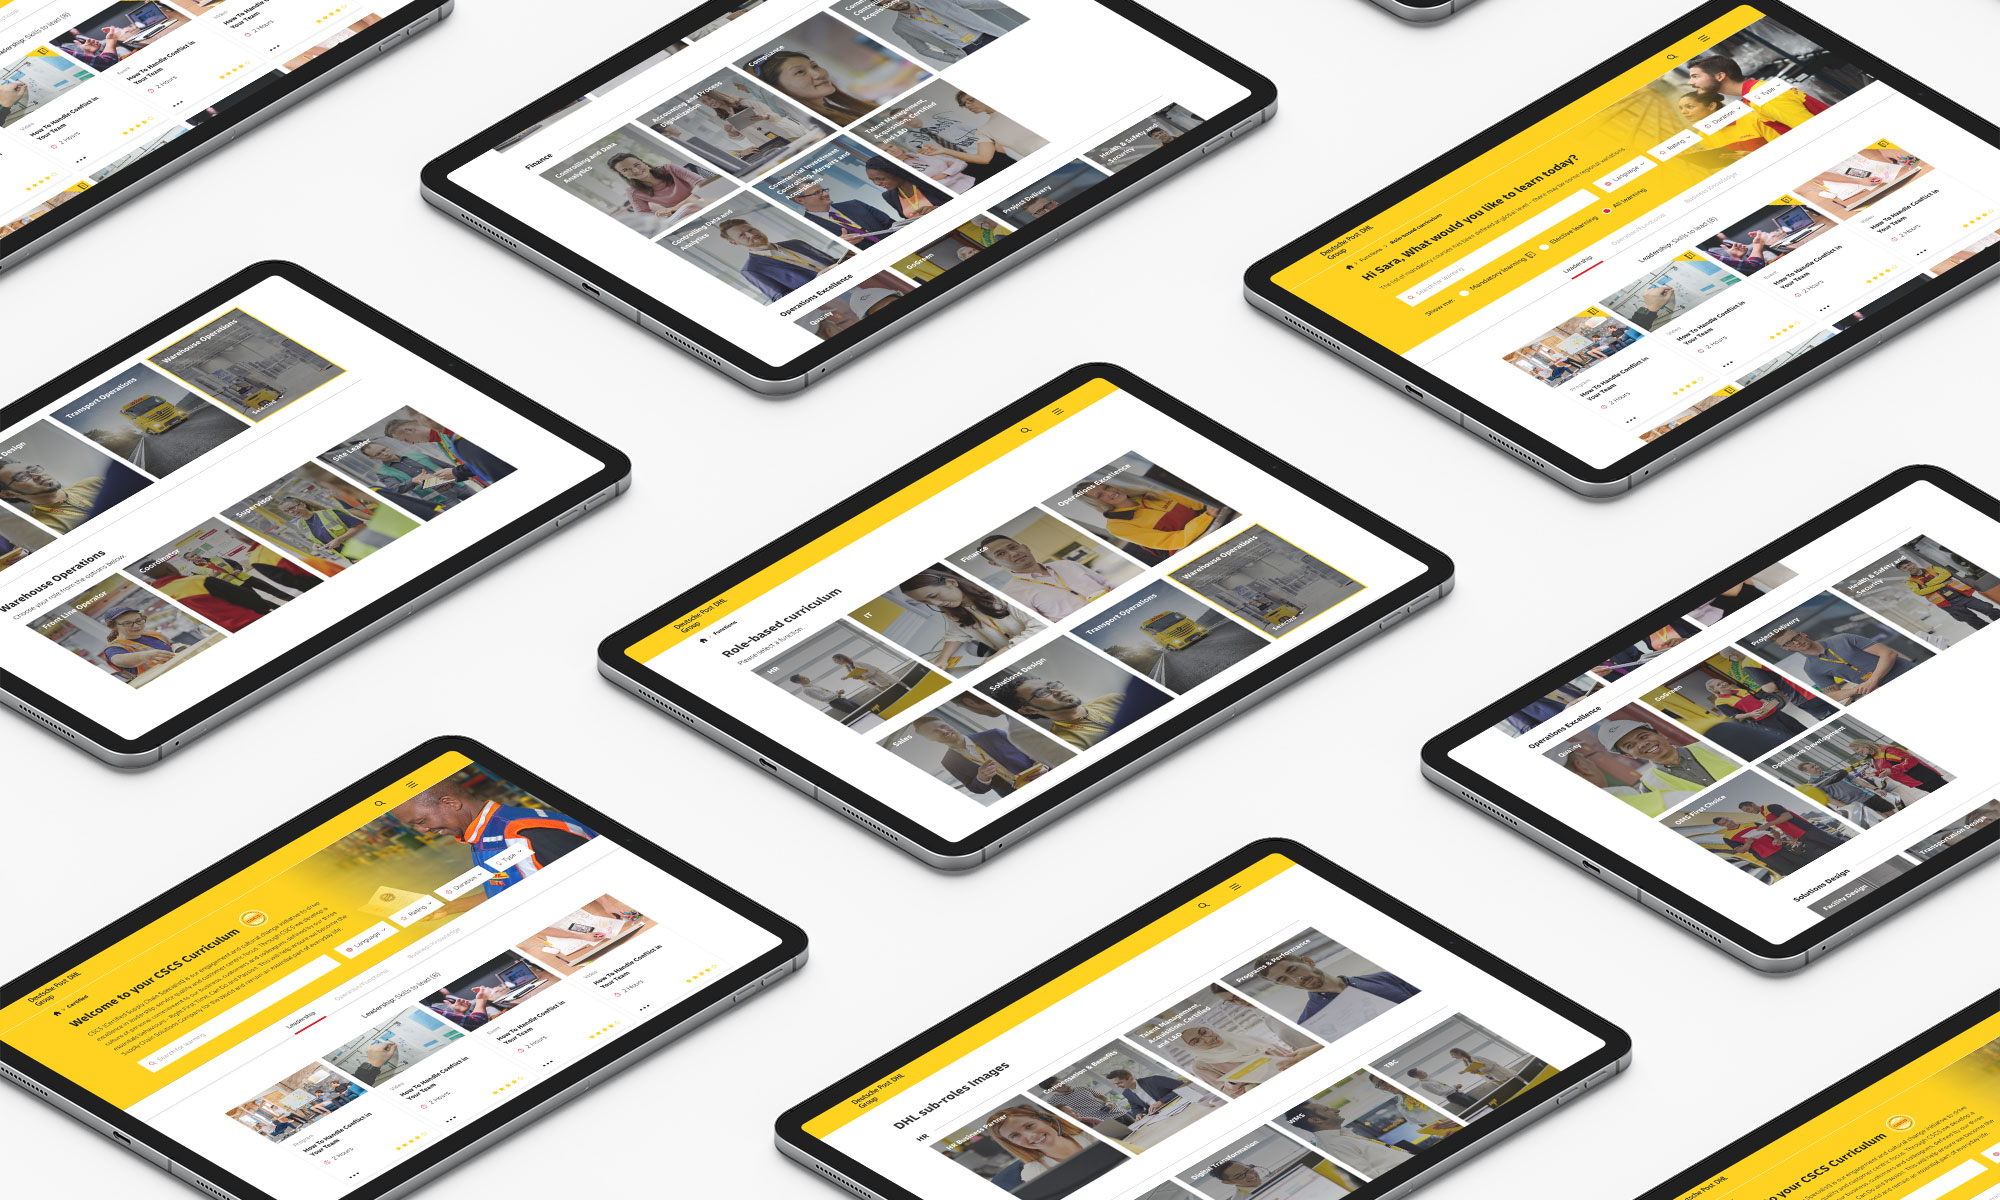
DHL
Cygnet
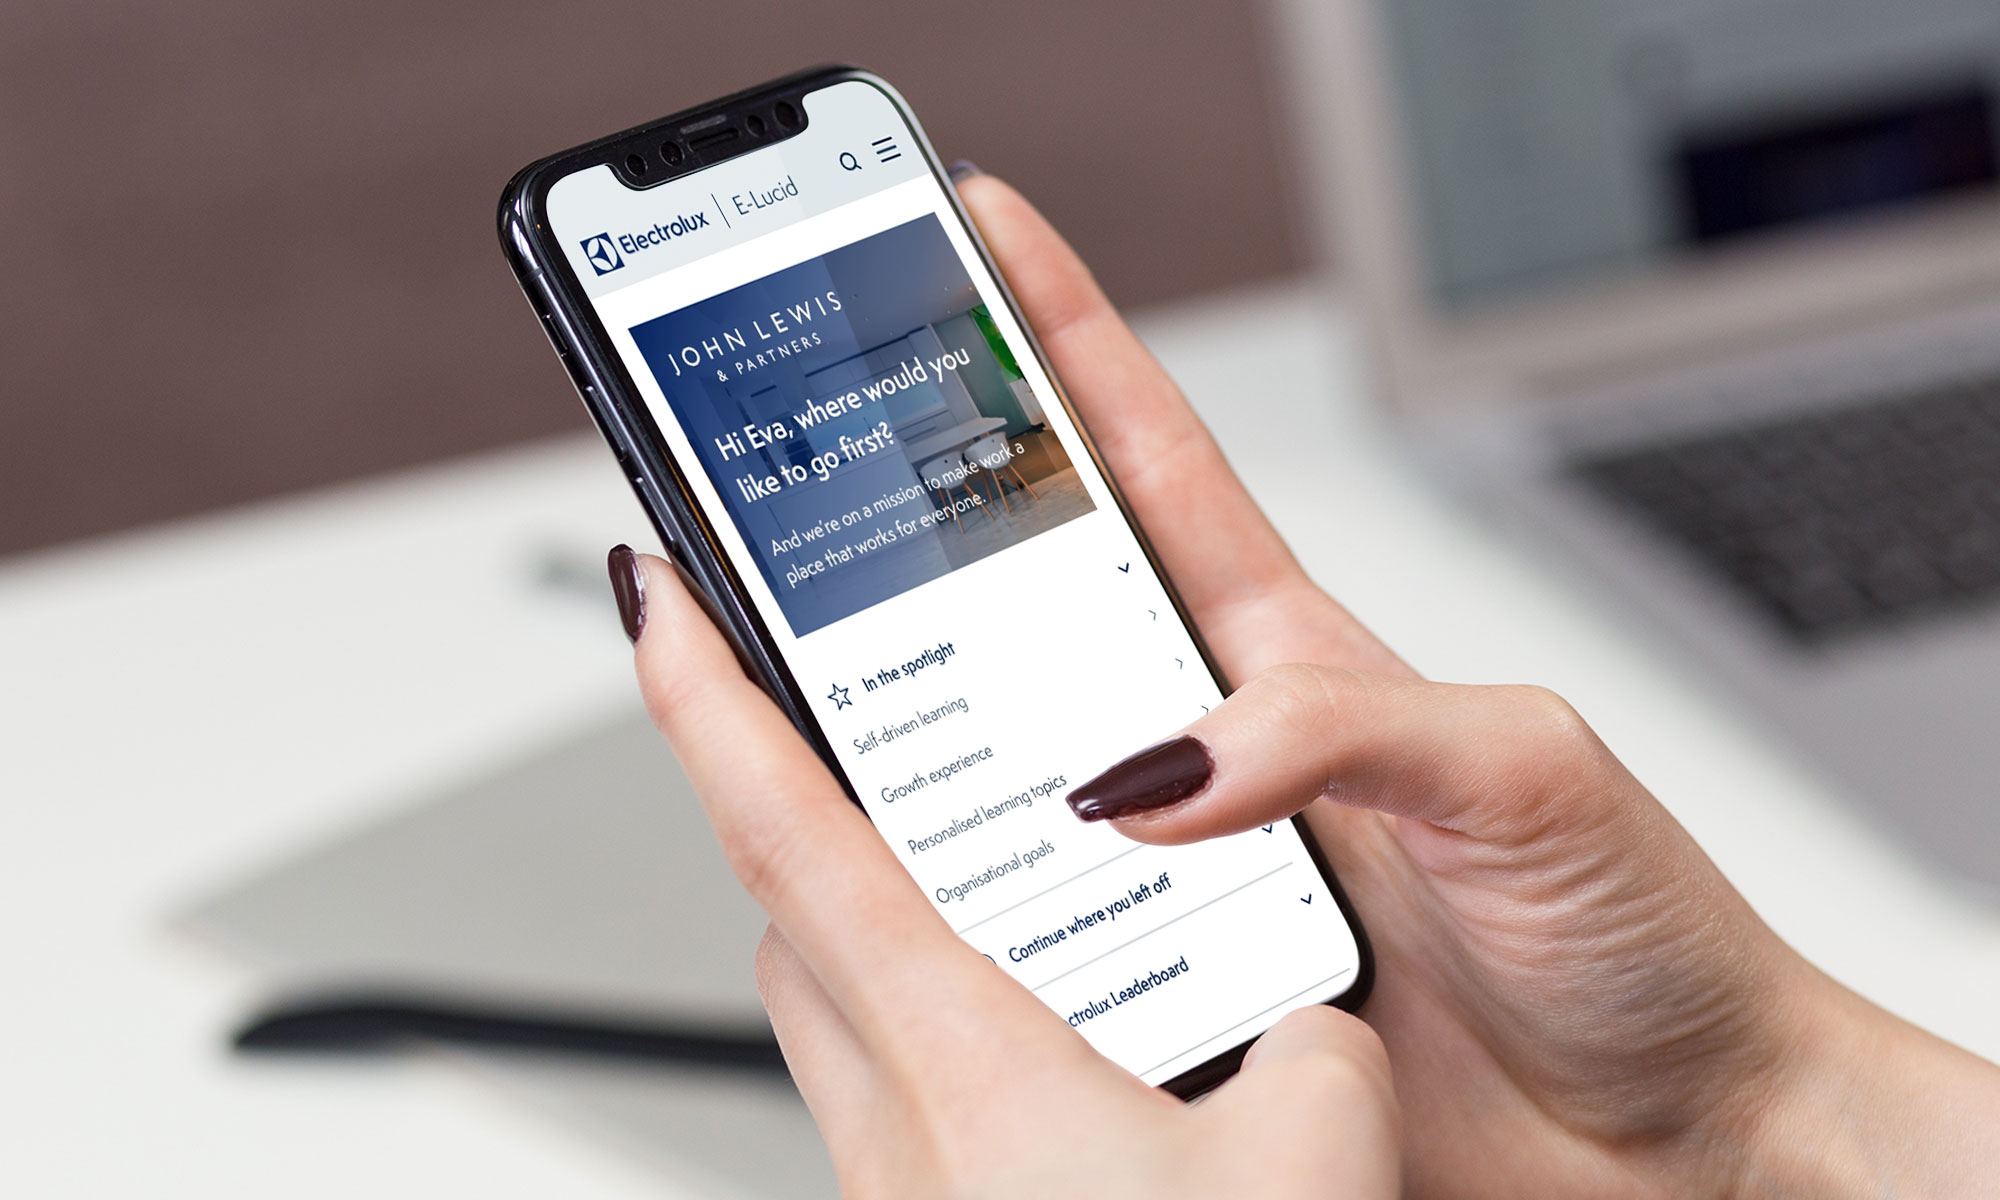
Electrolux
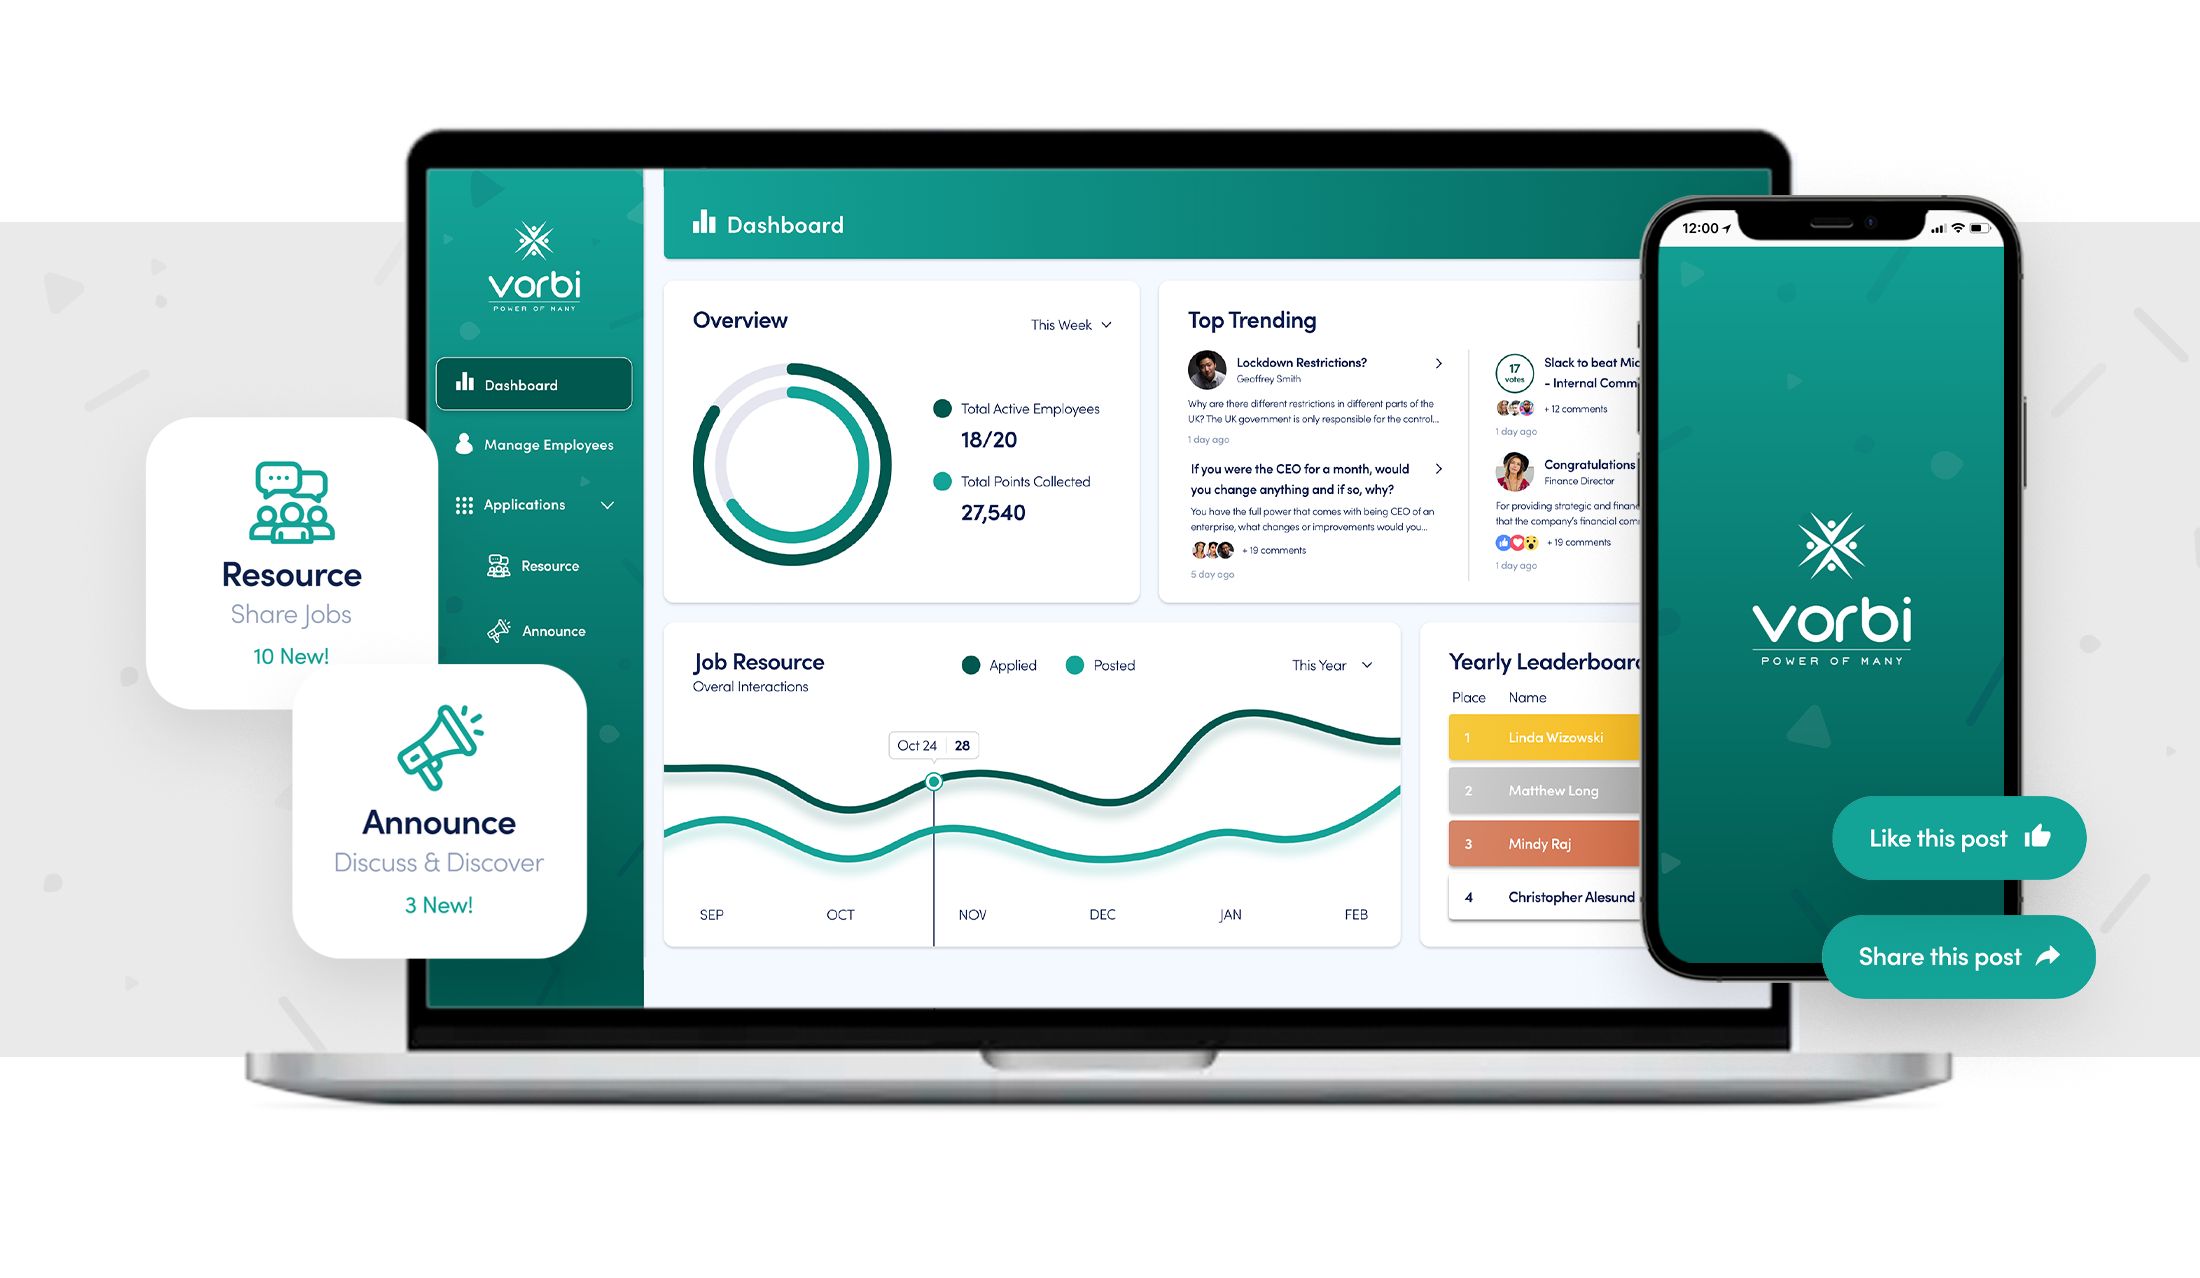
Vorbi